overleaf template galleryLaTeX examples — Recent
Examples to help you learn how to use powerful LaTeX packages and techniques.
Este es un ejemplo de un documento donde se incluyen partes en español y además las referencias de APA
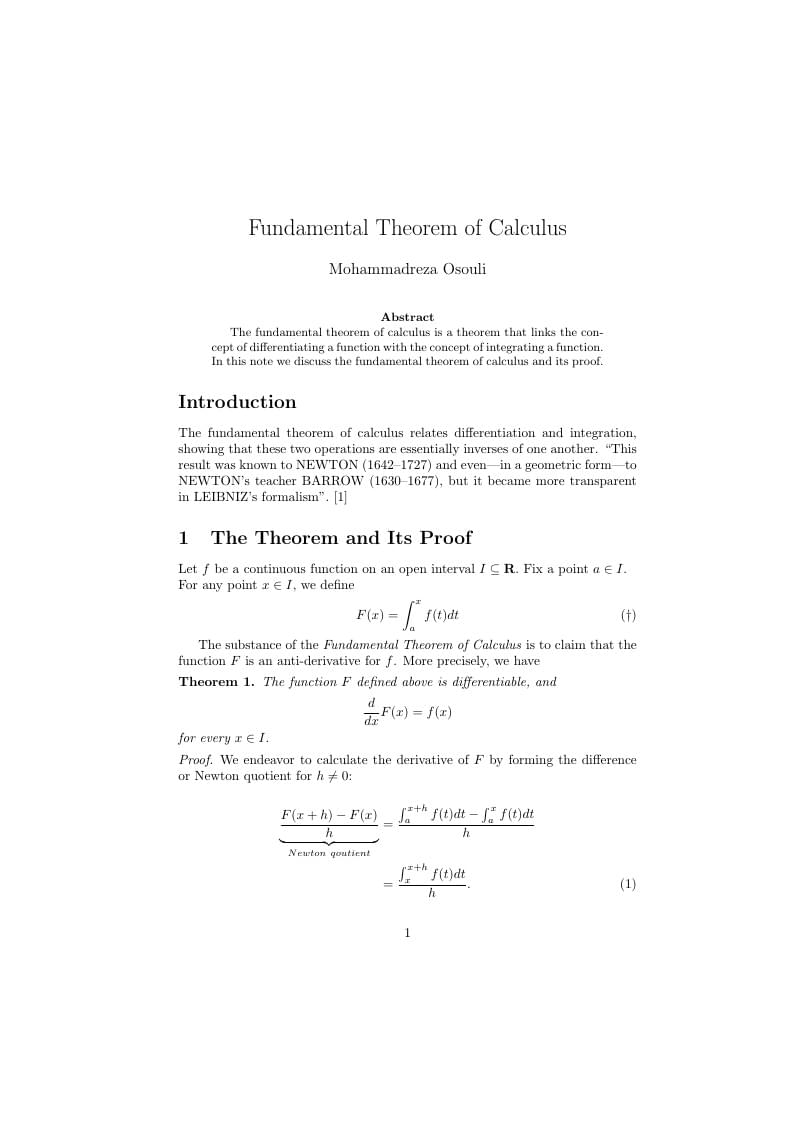
University of Tehran scientific writing exercise. Semester Spring 2019
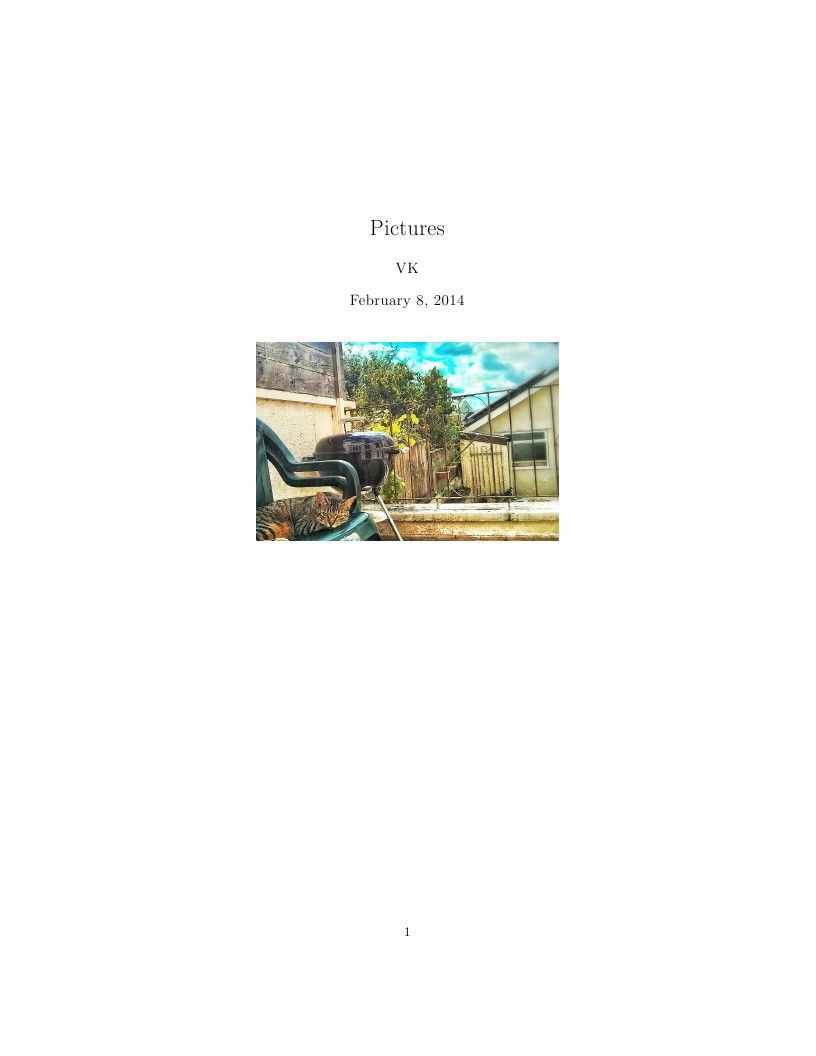
Pictures
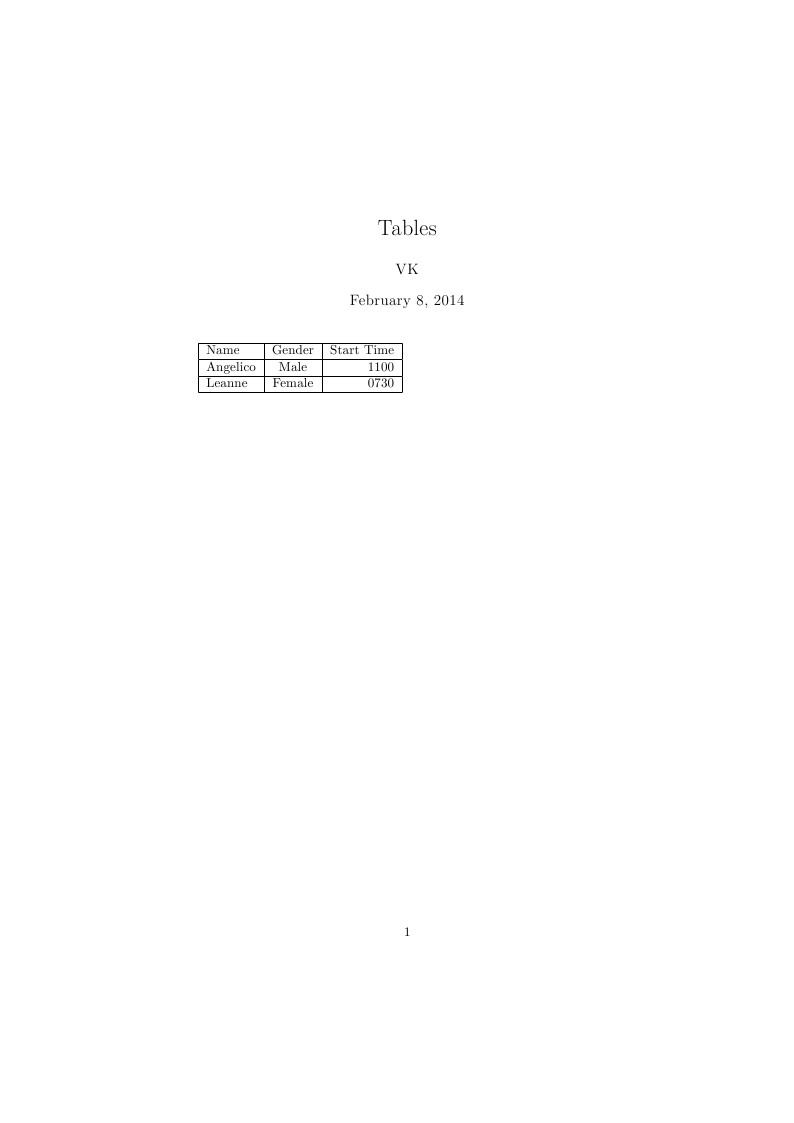
Tables
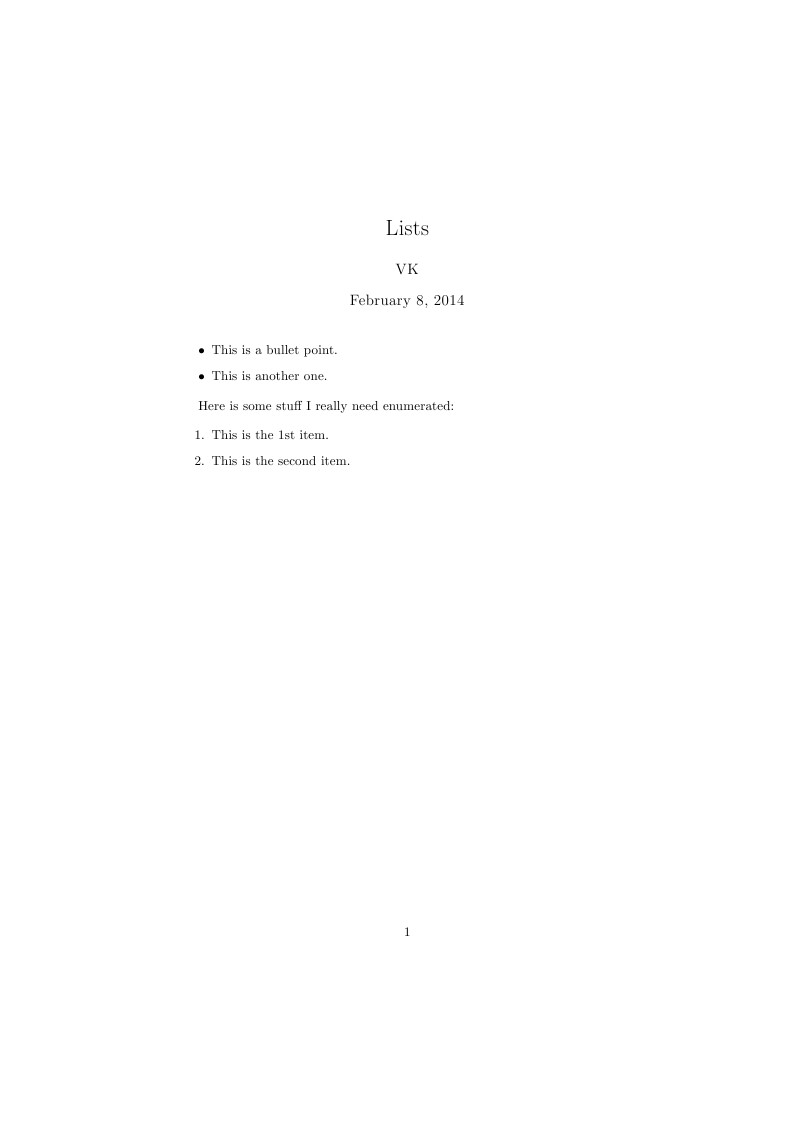
Lists
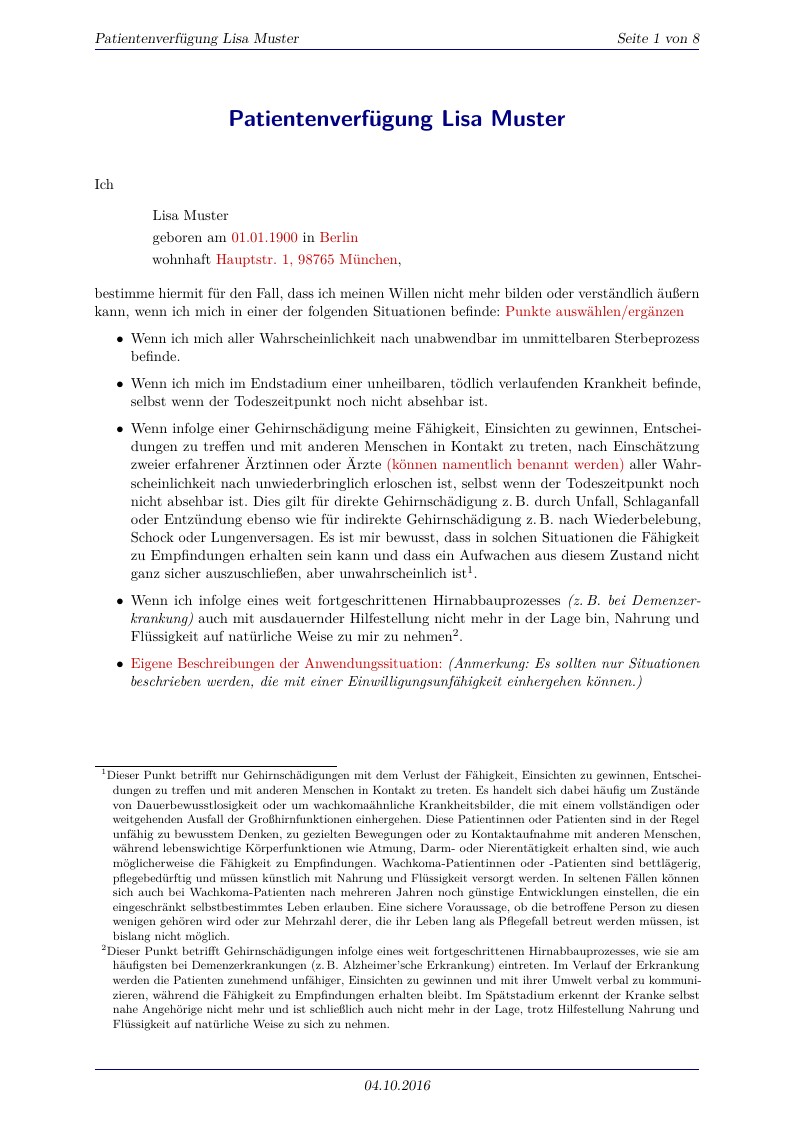
Textbausteine aus der Broschüre "Patientenverfügung" Herausgeber: Bundesministerium der Justiz und für Verbraucherschutz berücksichtigt die Vorgaben des BGH-Beschlusses (XII ZB 61/16) vom 06.07.2016 Textbausteine zur Broschüre "Patientenverfügung" im Word-Format (abgerufen am 04.10.2016)
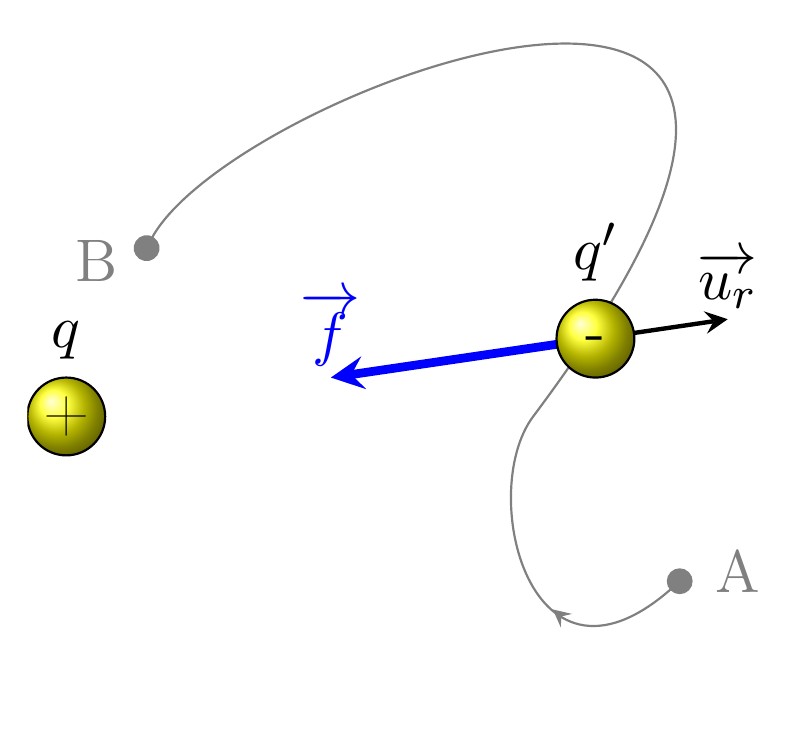
Ce document regroupe les codes TIKZ des figures utilisées pour le cours "Potentiel et énergie électriques" situé à la page http://femto-physique.fr/electromagnetisme/potentiel_electrostatique.php

Esta ilustración representa el símbolo que se halla en la franja central de la bandera de India, denominado Ashoka Chakra que es una representación del 'dharmachakra' ('la rueda de la religión', en idioma sánscrito), la cual consta de 24 radios que representan una hora del día. La rueda representa la prevalencia de la justicia durante las 24 horas del día. Los detalles técnicos de la Ashoka Chakra aparecen en la norma india IS-1 de 1968, refrendada en el año 2003. El archivo se halla en la página https://law.resource.org/pub/in/bis/S12/is.1.1968.pdf (pp. 13-14)
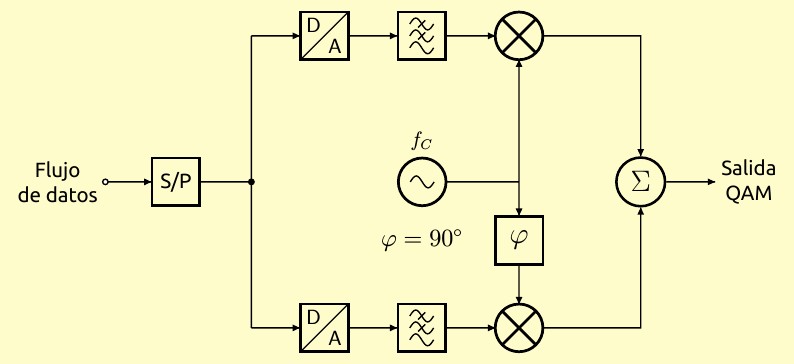
Block diagram of a QAM modulator used in digital communication technologies. Diagrama en bloques de un modulador QAM usado en tecnologías digitales de comunicaciones.
\begin
Discover why over 25 million people worldwide trust Overleaf with their work.