LaTeX templates and examples — TikZ
Recent
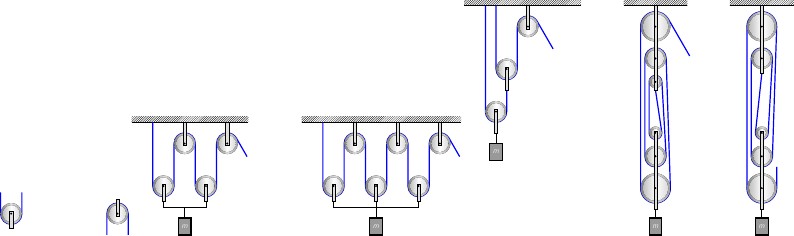
Flaschenzug, pulley
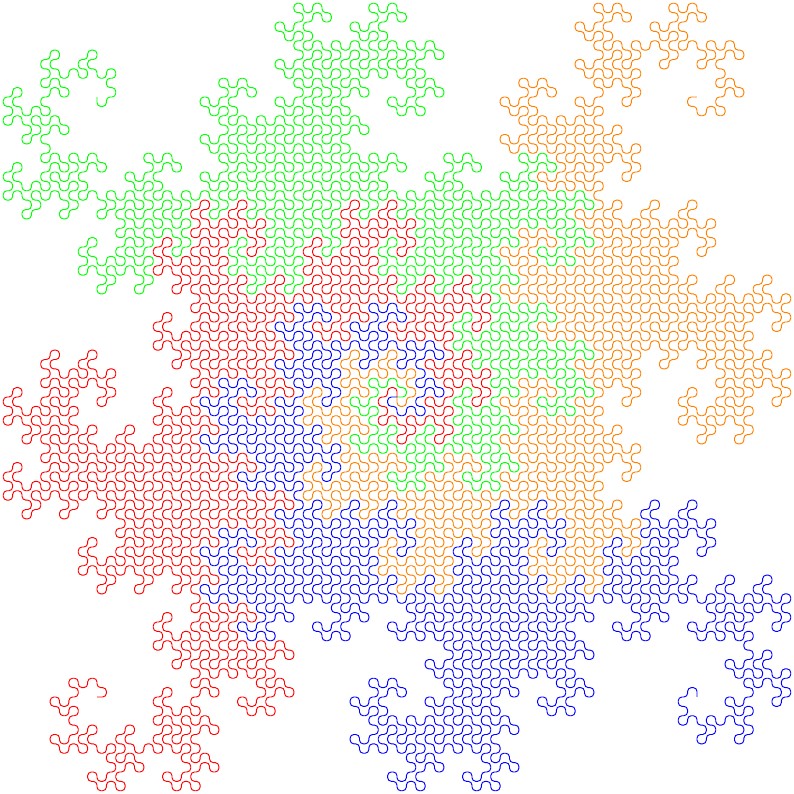
Four dragon curves tessellating the plane using tikz. Order of recursion limited by TeX memory/compile timeout.

Esta imagen es una "carta de ajuste", dividida en 4 franjas o patrones, usada en televisión de Alta Definición para comprobar la fidelidad de las señales de color transmitidas. Este patrón, en la actualidad, se encuentra incorporado a los equipos usados para pruebas de televisión en transmisores que se encuentran en mantenimiento. La cantidad de barras y tonalidades de color en cada franja se encuentran definidos en la norma estadounidense SMPTE RP 219-2002, que es la variante en Alta Definición de la norma SMPTE EG-1-1990 y que es descrita en parte en el documento "Audio/Video Connectivity Solutions for Virtex-II Pro and Virtex-4 FPGAs" pp 383-384 y las dimensiones aproximadas de los patrones están en el estándar japonés ARIB STD-B28 página 8.
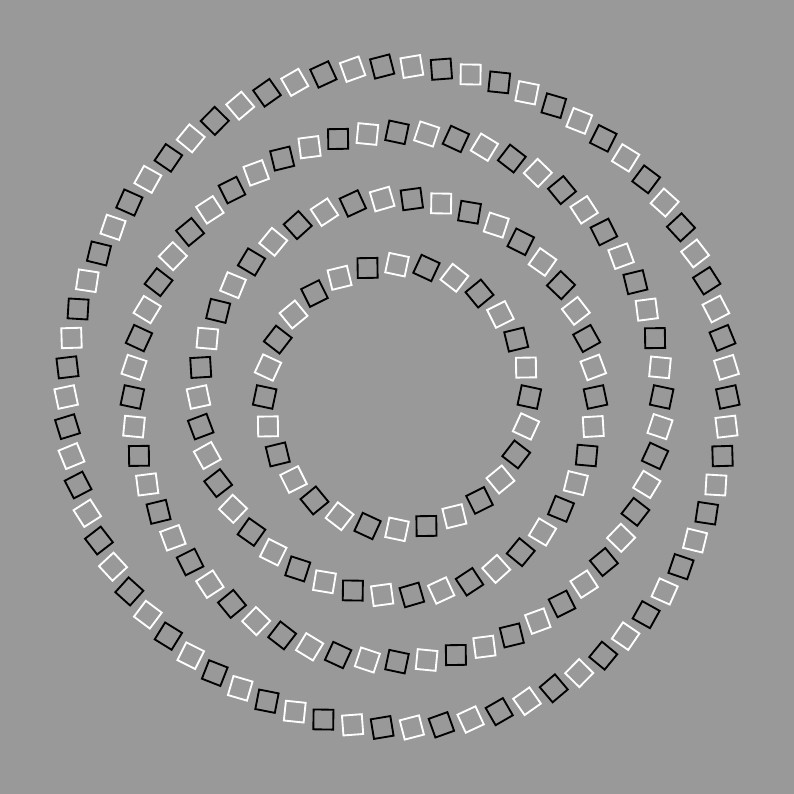
Submitted as an answer to the Showcase of Optical Illusions question on TeX SX. Click the Illusions tag below to see more!
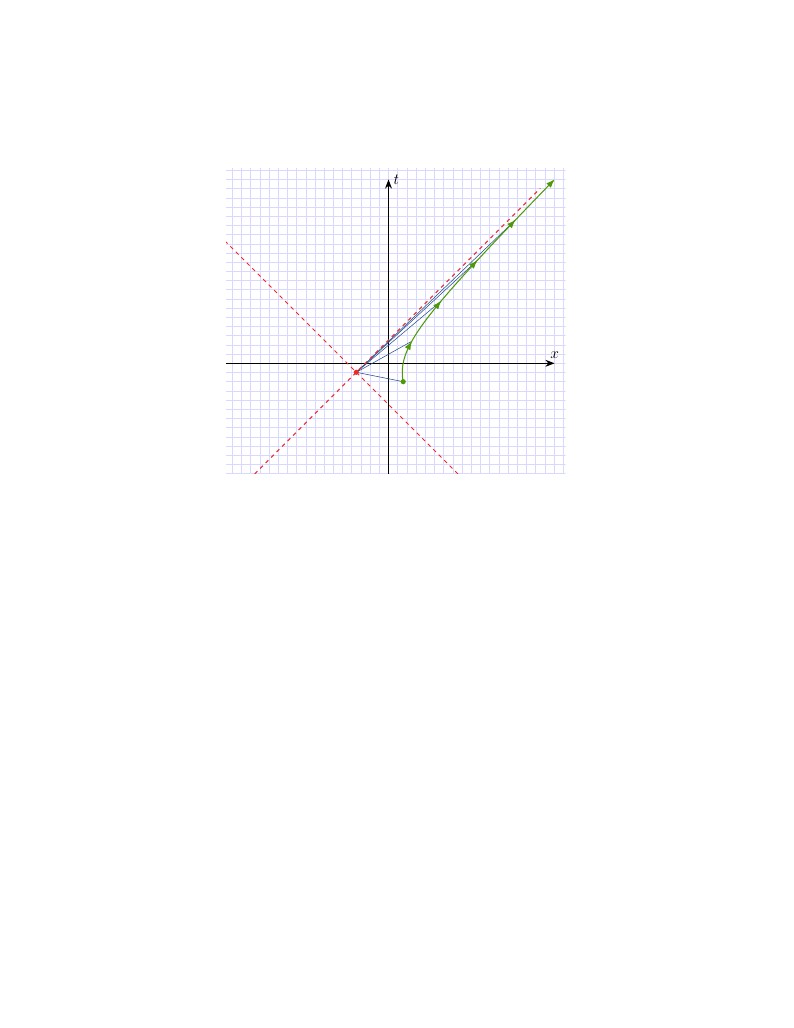
Use TikZ/PGF to programmatically draw spacetime diagrams for uniformly accelerated observers. Set the acceleration, initial conditions, and other parameters. Questions/Comments to Robert McNees at rmcnees@luc.edu, http://jacobi.luc.edu January 2015
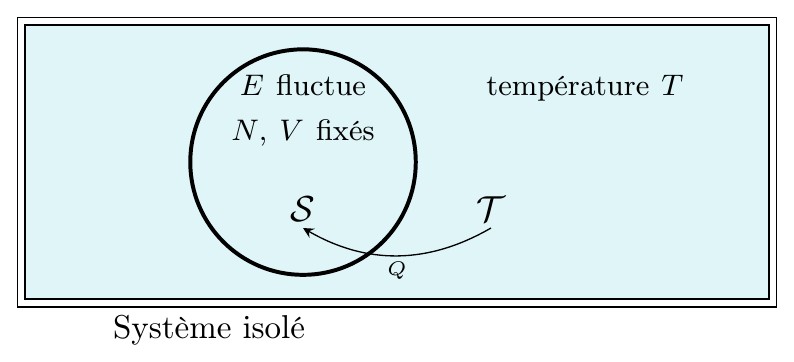
Ce document regroupe les codes TIKZ des figures utilisées pour le cours "Systèmes en équilibre thermique" situé à la page http://femto-physique.fr/physique_statistique/phystat_C2.php
LaTeX isn't just for reports and papers - the powerful TikZ package can be used to create professional graphics and diagrams with only a few lines of text Here's the perfect example from TeXample.net that's pre-loaded in writeLaTeX for you to try out - just click to open & edit online instantly. For comments and discussions on this example, see the TeXample page. New to LaTeX and want to find out more? Our Interactive Introduction to LaTeX course is freely available online, and Part 3 gives some great tips for creating your own presentations and drawings. Check it out today!

La figura representa la bandera de Puerto Rico, de gran semejanza a la de Cuba ya que el grupo de separatistas puertorriqueños que adoptó el diseño de la bandera como emblema de su grupo, estaba asociado a los separatistas cubanos que luchaban con idénticos ideales. Sobre la identidad del autor del diseño, se sostiene que fue el patriota puertorriqueño Francisco Gonzalo Marín quien propuso a su compatriota José de la Matta Terreforte el diseño de la bandera y que después fue adoptada. A diferencia de la bandera de Cuba, en la de Puerto Rico se intercambian los colores de las barras y el triángulo equilátero y su relación de aspecto alto/largo es 3:2. Los detalles de diseño y colores de la bandera han sido tomados de la página http://vexilla-mundi.com/puerto_rico_flag.html, ya que la ley y reglamento sobre su uso y diseño no ofrecen detalles específicos de la tonalidad de los colores rojo y azul.

Esta figura es la bandera de India, diseñada en 1947 por Pingali Venkayya (1876 - 1963), la cual se ha mantenido con sus características iniciales hasta el presente y cuya confección se rige mediante la norma india IS-1 de 1968, refrendada en el año 2003. El archivo se halla en la página (pp. 13-14). Los colores de la bandera han sido tomados de la página en Wikipedia ya que la norma no señala colores específicos para archivos informáticos. El emblema central de la bandera es la rueda de 24 radios Ashoka Chakra, cuyo código en LaTeX fue previamente publicado por Overleaf y fue incorporado al diseño en TikZ. El archivo codificado ha sido procesado como un nodo, removiéndole previamente sus encabezados.
\begin
Discover why over 25 million people worldwide trust Overleaf with their work.